Step By Step Guide to Detect Heap Corruption in Windows Easily
Introduction
Heap memory corruption is a critical issue that can lead to application crashes, data loss, and even security vulnerabilities. Detecting and addressing heap memory corruption early is crucial for maintaining the stability and security of Windows applications. In this blog post, we will explore how to detect heap memory corruption using two powerful tools: DebugDiag and AppVerifier.
Must Read : synchronization in C++20.
Understanding Heap Memory Corruption
Heap memory is a dynamically allocated memory space used by applications to store data at runtime. Heap memory corruption occurs when an application writes data beyond the allocated memory boundaries, leading to memory leaks, crashes, and unpredictable behavior. Detecting such corruption manually can be time-consuming and complex, making automated tools invaluable for identifying and diagnosing these issues.
What is PageHeap?
PageHeap specifically focuses on detecting heap-related problems, like heap overflows, heap underflows, and other memory allocation and deallocation errors. It works by modifying the memory allocation behavior of an application's heap, making it easier to identify incorrect memory usage patterns. When PageHeap is enabled for an application, it inserts additional space between allocations in application's heap, which helps catch buffer overflows and underflows that might otherwise go unnoticed.
PageHeap works as follows:
Heap Modification: When PageHeap is activated for a target application, it modifies the default heap manager behavior. Each memory allocation is surrounded by guard pages, which are inaccessible memory regions.
Guard Pages: Guard pages are unallocated memory areas placed before and after each memory allocation. If an application attempts to write beyond its allocated memory, it will hit a guard page, causing an access violation and triggering an exception.
Detection: When the application violates guard pages by writing to or reading from them, an access violation exception is raised. This allows Application Verifier to intercept the error and provide diagnostic information about the specific memory access that caused the violation.
Debugging Information: Application Verifier generates detailed logs, including call stacks and memory addresses, to help developers pinpoint the exact location of the heap-related issue.
Checkout the video on Detecting Heap Corruption:
DebugDiag
DebugDiag (Debug Diagnostic Tool) is a powerful utility from Microsoft that assists in analyzing application crashes and memory issues. It can be used to create memory dump files when a crash or memory corruption occurs, enabling detailed post-mortem analysis.
AppVerifier
AppVerifier is another powerful tool provided by Microsoft to detect a wide range of application issues, including heap memory corruption. It helps developers identify problematic code paths that lead to memory-related issues.
Steps to Detect Heap Corruption
- Install DebugDiag and AppVerifier
- Configure AppVerifier to Intercept the Invalid Heap Access
- Start the AppVerifier from start->programs
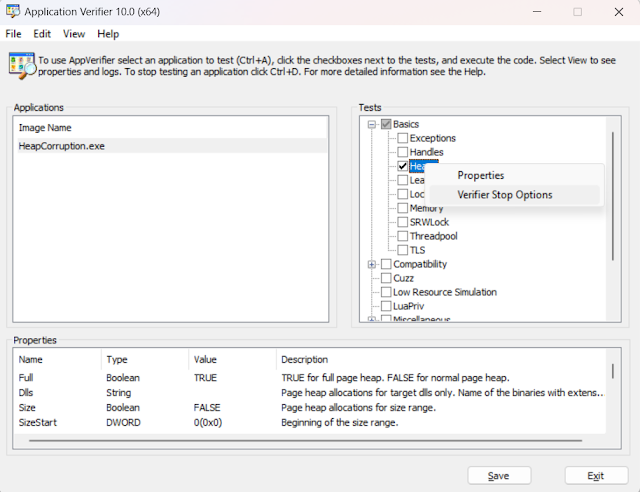
- Add the Application for which the heap corruption should be monitored as shown in the figure below and check the Heap in the Test
Configuring AppVerifier
Configure the Verifier Stop options by right clicking on the Heaps Test as shown in the figure below:Configuring Verifier Stop Options - In the Verifier Stop Options set the settings as shown in the figure below:
Verifier Stop Options Settings - Save the AppVerifer Settings and Open the Debug Diag from the programs.
- Add a Crash Rule which complements what is set in the AppVerifier
Conclusion
Detecting heap memory corruption is crucial for maintaining the stability and security of Windows applications. By leveraging tools like DebugDiag and AppVerifier, developers can automate the process of identifying and diagnosing heap memory corruption issues. Regularly using these tools during the development lifecycle can help catch memory-related problems early, reducing the risk of crashes and vulnerabilities in your applications. Remember to always prioritize memory safety and thorough testing to ensure the reliability of your software.


Comments
Post a Comment