OpenTelemetry Tutorial — Practical Tracing, Sampling, and Cost-Control for Microservices
Surprising fact: unchecked traces can be one of the fastest-growing items on your observability bill — teams report cutting trace ingestion by 70–90% with sensible sampling and pipeline tuning while retaining 90%+ of the actionable signal. This guide gives pragmatic, multi-language steps to instrument backend microservices, choose sampling strategies, and control cost in production.
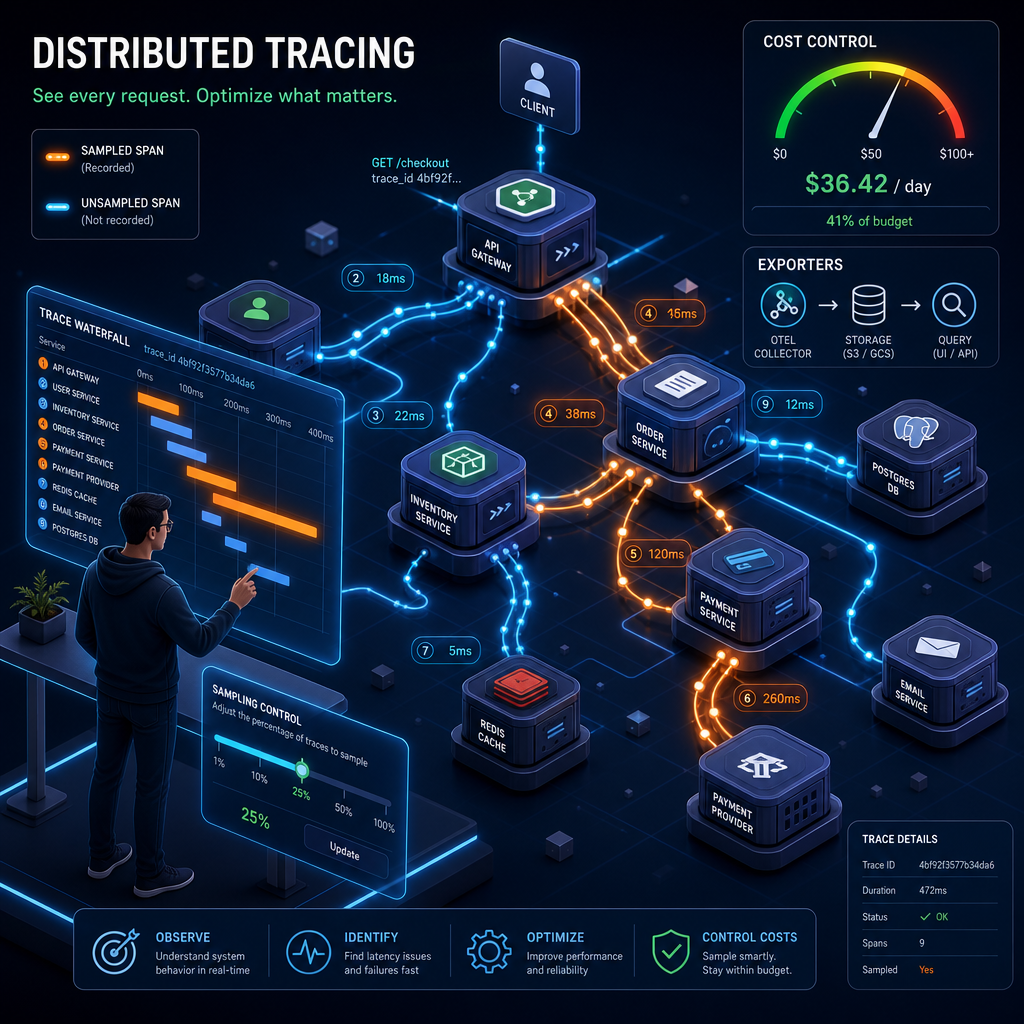
Why OpenTelemetry matters for microservices
Microservices multiply the surface area for failures. Distributed tracing solves the “which service failed?” problem by connecting spans across processes. OpenTelemetry (OTel) is the de-facto standard SDK + collector ecosystem that unifies metrics, traces, and logs. Adopt it to get consistent context propagation, vendor portability, and a single place to apply sampling and redaction rules.
Common pitfalls: instrumenting everything with 100% fidelity (exploding costs), inconsistent naming across languages, and missing context propagation in async flows.
Tracing fundamentals
Keep these concepts front-and-center:
- Trace: a request workflow made of spans.
- Span: a timed operation (name, start/end, attributes, status).
- Context propagation: headers or binary transport that carry trace IDs across RPC or messaging boundaries.
- Instrument what matters: prioritize high-traffic endpoints, slow/erroneous paths, and business transactions—avoid blind instrumentation of every DB call at 100%.
Quick instrumentation examples
Below are minimal examples to get traces flowing. These are starter snippets — production requires semantic conventions, error handling, and resource attributes.
Node.js (Express) - OTLP exporter
const { NodeTracerProvider } = require('@opentelemetry/sdk-trace-node');
const { OTLPTraceExporter } = require('@opentelemetry/exporter-trace-otlp-http');
const { SimpleSpanProcessor } = require('@opentelemetry/sdk-trace-base');

const provider = new NodeTracerProvider();
provider.addSpanProcessor(new SimpleSpanProcessor(new OTLPTraceExporter({ url: 'http://otel-collector:4318/v1/traces' })));
provider.register();
Go (net/http)
tp := sdktrace.NewTracerProvider(sdktrace.WithBatcher(exporter))
otel.SetTracerProvider(tp)
// Wrap handlers
handler := otelhttp.NewHandler(myHandler, "checkout")
http.Handle("/checkout", handler)
Java (Spring Boot)
// Add opentelemetry-javaagent to JVM args:
// -javaagent:/path/opentelemetry-javaagent.jar
// Configure OTLP endpoint via OTEL_EXPORTER_OTLP_ENDPOINT
These snippets show OTLP export to a Collector; a Collector gives you centralized sampling, batching, and exporter flexibility.

Sampling strategies — pick the right tradeoffs
Sampling determines which traces are sent off-cluster. Choose pragmatically:
- Head-based (probabilistic): cheap, applied at SDK time, e.g., 1% of requests. Good for steady-state cost control.
- Tail-based: expensive (must buffer traces) but powerful — you can sample all traces that later show errors or latency spikes.
- Adaptive / SLO-driven: dynamically increase sampling for transactions impacting SLOs or during incident windows.
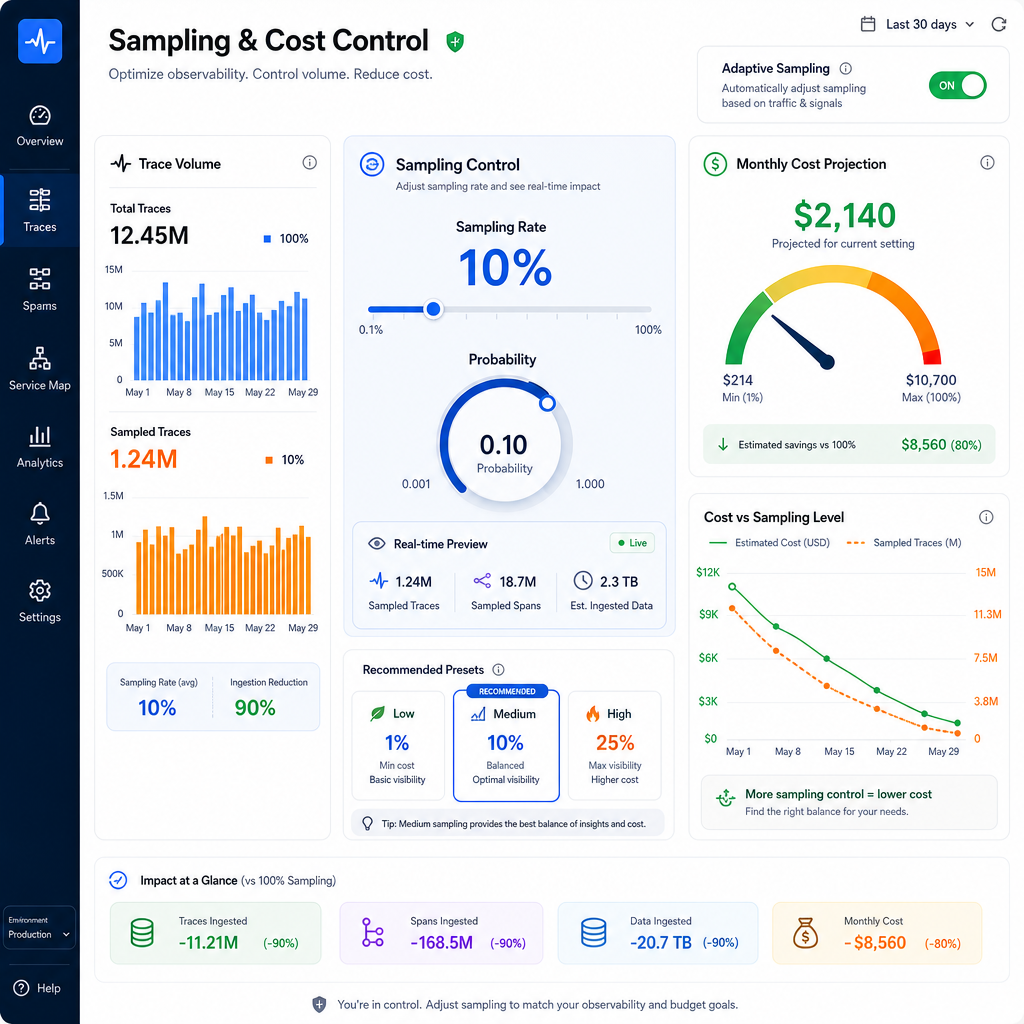
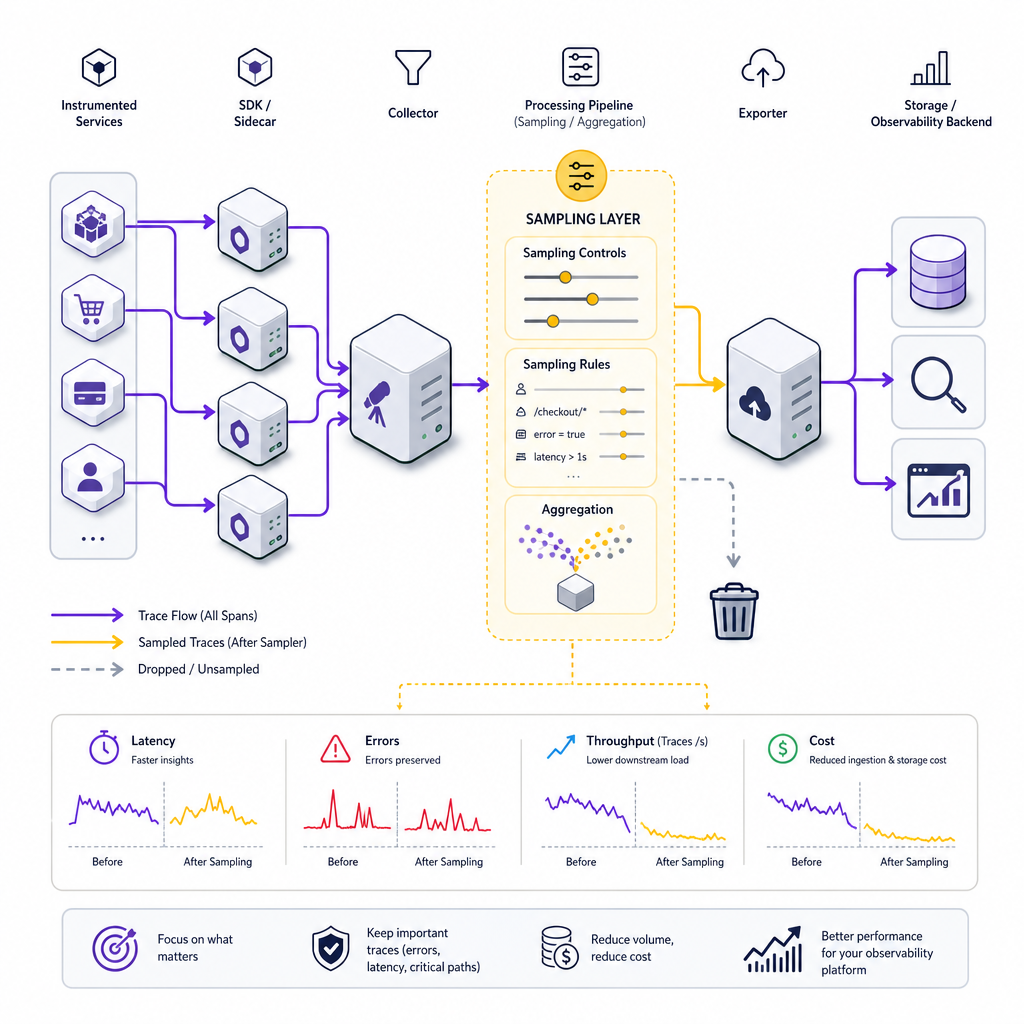
Recipe (practical): use a low-rate head sampler (0.1–1%) for background telemetry, plus a tail-sampling policy in the Collector that keeps 100% of traces with error status or traces that exceed latency thresholds.
Exporters and backends — integration patterns
Common pattern: SDK -> OTel Collector -> backend. Use the Collector for batching, compression, retry, and sampling policies. Backends: Jaeger/Zipkin (open-source), Honeycomb/Lightstep (commercial). Choose OTLP as the wiring format for portability.
Cost-control techniques
Practical knobs:
- Batching & compression: configure SDK and Collector batch sizes and timeouts to reduce network calls and egress.
- Rate-limiting: apply service-tiered per-second caps in the Collector.
- Smart sampling policies: tier endpoints (critical, normal, low-value) and apply different rates; use tail-sampling for errors.
- Retention planning: keep high-fidelity traces for a short window (e.g., 7–14 days) and aggregated summaries longer.
Example cost math: if average trace contains 12 spans and you serve 100K requests/day, sampling at 1% yields ~12K spans/day vs 1.2M spans/day at 100% — a 100x reduction in storage/egress. Even after keeping 100% of errors via tail sampling, cost remains manageable.
Operational checklist
- Test context propagation with end-to-end smoke tests and CI checks.
- Integrate OTel SDK health metrics into Prometheus for collector and SDK health.
- Build dashboards for sampled vs unsampled traffic, sample-rate coverage, and ingestion billing alerts.
- Set CI gates to prevent PII attributes from being added to spans (debugging techniques).
- Plan a phased rollout: platform services -> high-value business transactions -> wide instrumentation.
Real-world case study
An anonymized mid-size e-commerce company instrumented three backend services (Node.js API, Go cart service, Java payment service) and initially sent 100% of traces to a managed backend. After deploying a Collector with a hybrid sampling policy (0.5% head-based global + tail-sampling for error and 95th-percentile-latency traces) and batching/compression, they reported:
- Trace ingestion down 85%
- Monthly observability bill reduced by ~60%
- Mean time to identify (MTTI) incidents improved by 40% because high-fidelity traces were preserved for problematic requests
This illustrates the cost-first tracing playbook: measure, tier traffic, deploy conservative head sampling, then add targeted tail-sampling for signal preservation.
Unique insight — SLO-driven adaptive sampling
Instead of static rates, tie sampling to SLO signals: when error budget burn accelerates, raise sampling for affected services or endpoints. Use a controller to update Collector sampling rules (webhook-based) so you capture the needed forensic traces only when they matter.
Conclusion — next steps
OpenTelemetry gives you vendor portability and powerful control points (SDK + Collector) to balance signal vs cost. Start with lightweight, consistent instrumentation across languages, enforce semantic conventions in CI, and use a hybrid sampling policy to preserve important traces while cutting spend.
Get the complete guide with templates and checklists in our digital product — OpenTelemetry it includes multi-language sample repos, OTEL Collector YAMLs for cost-optimized and high-fidelity pipelines, tail-sampling policy templates, and a cost calculator so you can model monthly spend before rollout.
Want practical starter assets now? Grab the guide and the repo: it has runnable examples for Node.js, Go, and Java, plus automated CI checks and privacy scrubber examples. Microservices architecture API design best practices


Comments
Post a Comment